Before reading any results or comparing the figures of our region to those of other regions (in France or Europe) or to national averages, it is important to well know the specifications of the survey.
As the AEC, observatory of Aquitaine area, wrote it down in its 2005 diagnosis: “the figures abound, methodologies differ from one study to another, the periods of reference seldom line up and it is sometimes difficult to identify what some formulations cover”. The « SOURIR » network, through the gathering of 12 French-speaking areas, leads investigations on the ICT uses in their regional space, and tries to remedy to this problem by establishing especially compatible methodologies and indicators.
It is also in that sense that M@rsouin publishes its methodological report and warnings.
The “Residential” survey of M@rsouin is an annual survey which is in its fourth year of existence. It collects information on the equipment and the use of the means of telecommunication, such as computers, the Internet and GSM... from a sample of Breton individuals. By Breton individuals, it is meant the people living in Brittany (the 4 departments), without considerating their origins.
Execution and warnings.
The survey was carried out by phone during the months of November and December 2005, just before the holidays, like each year.
– Attempt to contact
A little more than 12000 calls were made in total. The people, through their home phone number, were contacted 6 days out of 7, at various hours (9 a.m. to 8 p.m.) and so on several occasions. On these 12000 calls, 2120 led to the beginning of interviews among which 2051 were finalized (which makes 3% of abandonment). The other calls correspond either to refusals (13% of the total calls), or to unreachable people, to engaged numbers or to people answering but not taken into account (because of a different language, because they are not the target of our survey or off-scale...).
It is pointed out that, as in any survey, only the people who agreed to answer appear in our survey and thus constitute the results.
Coverage, base of the survey and exclusions.
The coverage of this survey only focused on the population of individuals at least 15 years old. This choice was established in particular to enable us to compare the results with many national and regional surveys.
– Choice of the base of survey
On the contrary to the majority of the other European countries (Sweden, Finland, Netherlands, Germany, Italy...), France doesn’t have any register of population, only the census of the population and the file of the phone suscribers can be used to form the basis of the survey. Since only the investigators of the INSEE are authorized by the CNIL to work using the census of the population, the base of the survey chosen is the directory of France Telecom. Of course, there exists also bases such as the files of EDF, the electoral rolls, lists of the direct taxation... but they are all insufficient if we wish to represent the general population correctly.
– Exclusions
Individuals that are ex-directory are thus excluded. The random generation of numbers is a method implemented to make it up for. However the latter, which makes it possible to reach all the numbers, is expensive and therefore leads to many wrong numbers (professionals, nonexistent...).
People who don’t live in a private household, such as for example the residents of reception centres, could not be reached.
– Limits of landline phones
Another limit of the base is that the “excluded from landline” population, people who no longer have or never had a rental to a landline phone, is thus not integrated.
– Characteristics of the“excluded from landline”
According to the 2005 edition of the IDATE, it is estimated that, in France, currently 15% the households have a mobile phone for unique phone line. An explanation could lie in the fact that the rise in the price of the rental is not entirely compensated by the fall (strong decreasing? reduction?) of the cost of phone calls. In addition, a generalization of VoIP offers, in the form of packages, coupled or not with an access to the Internet is witnessed. It is important to note that these “exclusive mobile phone users” present at the same time socio-demographic characteristics and specific behaviors. Criteria such as the age, the social and economic category and the composition of the household are particularly important. The « excluded from landline » are rather young, rather SPC and are rather part of 1 person-households. We can clearly assume that their behavior is different when we focus on the field which affects us, in other words the equipment and the use as regards the ICT. Excluding them from the base of the survey constitues a bias of representativeness in our surveys.
– Current means or directories
However, as long as a base of survey doesn’t exist in France, it is difficult to go by the prefixes, granted by the operators of mobile phones, which do not have any meaning on a geographical level and thus can appear useless in our studies aimed at dealing with regional matters. It must also be noticed that the constitution of a universal directory will perhaps solve the problem of the geographical location because ofthat, for the moment, only the suscribers who wish to be included will be part of it.
Sampling and representativeness.
In theory, people questioned for a survey should be randomly selected. That is called the random method: a certain number of persons are chosen and will constitute the sample to be questioned.
– Quota method
In France, this method is almost not applied, the institutions of survey use another technique, the Quota method. It consists in questioning a sample of people who have the same socio-demographic characteristics than the whole population. Compared to the random method, the Quota method has the advantage of being faster. With the random one, polled people are not’ interchangeable’. This means that the the person chosen must be recontacted as many time as necessary. Thanks to the Quota method, it is possible to replace a person polled by another who has the same socio-demographic characteristics.
Size of the sample
The size of the sample chosen is of 2000 interviews (in fact, 2051 investigations were carried out). This makes an approximation of the margin of error to? a maximum of more or less 2,2%. Consequently, as the precision can’t be better, the majority of the results will be presented in round percentages.
Selected criteria
The criteria of representativeness in the field we used are :
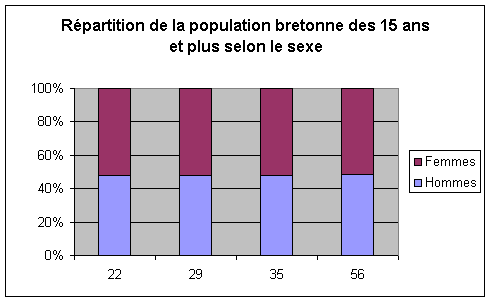
- sex by department
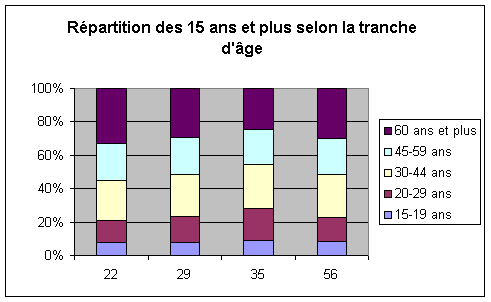
- age (15-19 years/20-29 years/30-44 years/45-59 years/60 years and more) by department
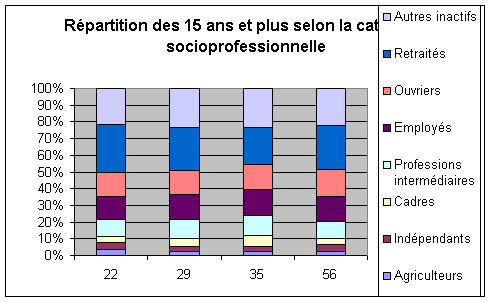
- occupation of the person interviewed ( farmer/freelance/senior executive/ intermediate profession /employee/worker/retired/inactive) by department
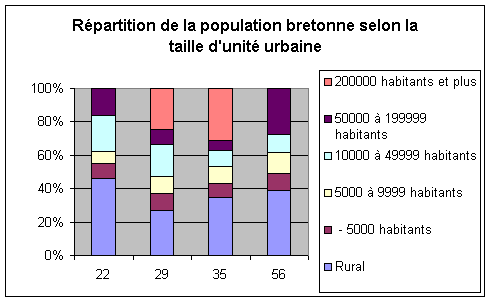
- size of the urban unit (rural/less than 5000 inhabitants/5000 to 9999 inhabitants/10000 to 49999 inhabitants/50000 to 199999 inhabitants/200000 inhabitants and more) by department.
The quotas to be respected were decided according to these classes in accordance with the data of the last census of the INSEE (figures of 1999 (see graphical appendices), given that those of 2004 are not yet available).
From the individual to the household.
There is no doubt than when we speak about use, it is related to the individual, however the computer, and Internet access equipment and the equipment in technologies rather correspond to concepts referring to the household.
– Double representativeness
Other concepts than the criteria mentionned above for the individuals, are to be taken into consideration for the representativeness of the households. However, since it was impossible for us, because of costs among other things, to carry out two surveys, one related to the individuals and the other related to the households, this survey has also been used.
– Criteria and definitions
The person polled thus answers for the equipment of the household. The representativeness of the households is ensured by a later rectification based on the characteristics of the household (department, size of the urban unit, size of the household, social and economic category of the person of reference). Even if the polled person is not the person of reference, the household “is built on” the characteristics of this person. According to the INSEE, “the person of reference of the household is defined by the familial structure of the household and the characteristics of the individuals who make it up. It is most of the time the person of reference of the family when there is one, or the oldest man, giving priority to the oldest working person”.
Additional signaletic.
Besides the variables of sampling which have just been described, the descriptive part of the survey was also improved by other variables which will also enable us to bring an interesting perspective on the data on equipment and use measured.
– New concepts
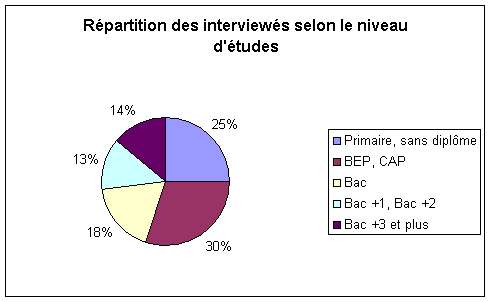
It is noticed that the presence of children and the age bracket of the children, the level of studies of the person interviewed, the status of activity, the social and economic category of the parents for the students and wheter they are or not still in the residence of the parents, the income of the household.
– The case of the question about the income of the household
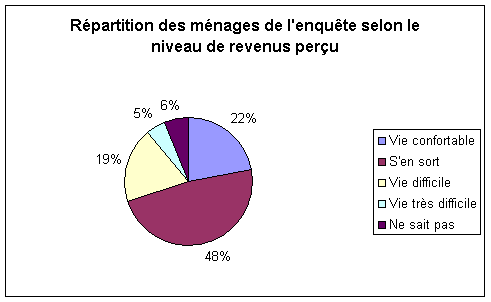
We point out that, it is very difficult to know the income bracket of the household even if it is for statistical purpose . For example, in this survey, 16% of interviewed people did not know how to position themselves and 22% refused to, which thus means that for 38% of the interviews this information is not available. To avoid this lack, a question, tested for several years now, and especially coherent with various social data (for instance, the social and economic category of the person interviewed, of the spouse, the level of study) gives us the standard of living perceived.
« Which description approaches the most of the opinion you have of the current income of your household?
- You have a comfortable life with the current income
- You get by with the current income
- You find life difficult with the current income
- You find life very difficult with the current income »
The rate of « I don’t know » then falls to 6%.
Graphical appendix